
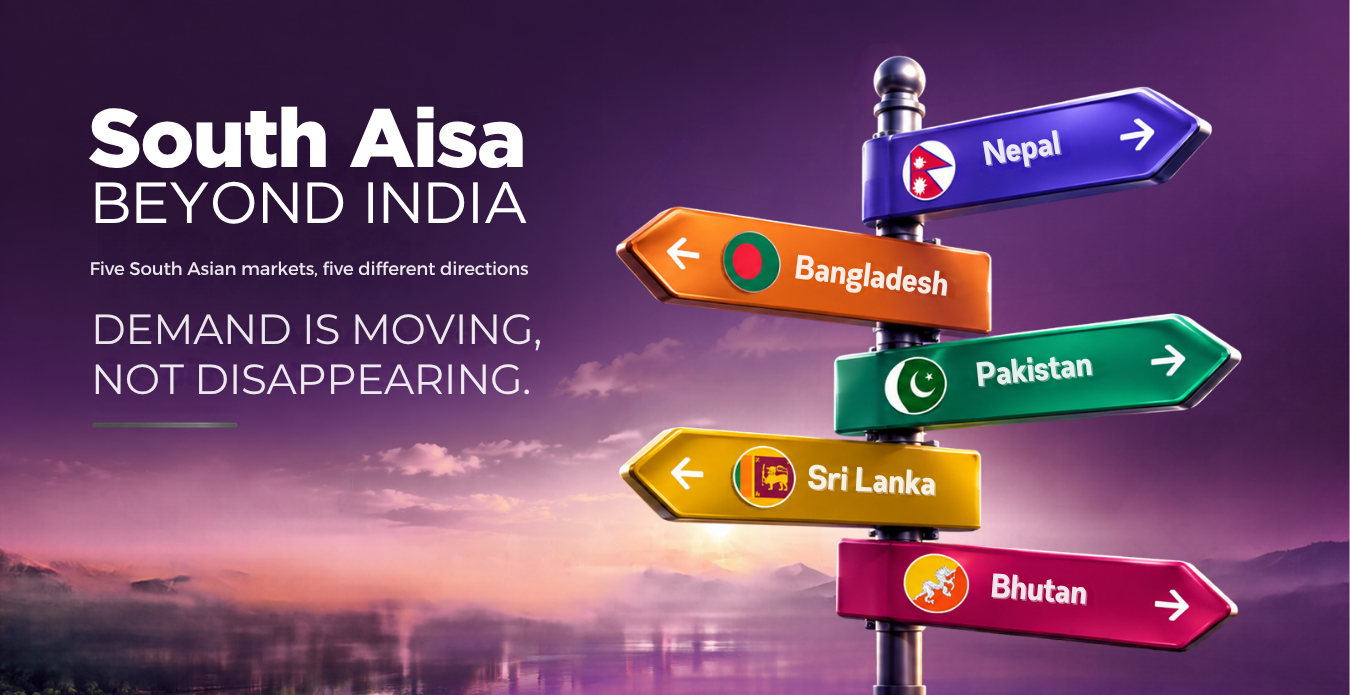
Five South Asian markets are moving in five different directions, often several at once, surging in some destinations and retreating hard in others, while India declines in nearly all of them at the same time.
India has dominated conversations about South Asian student mobility for so long that its recent slowdown is often read as a signal for the whole region. India’s own outbound departures have fallen for three consecutive years, from 908,000 in 2023 to 626,000 in 2025, and it would be natural to assume that demand across neighbouring markets has cooled in the same way.
The data available from the major destinations points to a more nuanced picture. Nepal, Bangladesh, Pakistan, Sri Lanka and Bhutan each behave differently from India and from one another, and the differences seem to depend as much on which destination is being observed as on which country the students come from.
The United States offers a useful starting point. In 2024/25 Nepal’s enrolled population grew 48.7 percent in a single year, the fastest rate posted by any country in the sector’s own enrollment data, while Pakistan’s grew 19.8 percent and Bangladesh’s grew 17.9 percent, each a record high and each well ahead of India’s 9.5 percent.
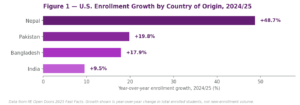
Figure 1 — U.S. enrollment growth by country of origin, 2024/25. Data from IIE Open Doors 2025 Fast Facts.
The United Kingdom shows a similar shift. Bangladeshi and Nepali visa issuance roughly doubled year over year in 2025 and Pakistan reached an all-time high, even as the UK’s overall student visa numbers were falling, while India’s sponsored study visas had already fallen 14 percent in 2024. Sri Lanka had earlier posted an equally striking 84 percent single-year jump in 2022/23, which the British Council described as “the fastest growing major market for the UK”.
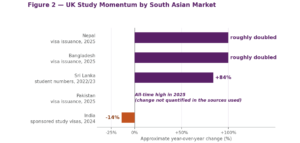
Figure 2 — UK study momentum by South Asian market. Data from British Council 2026 outlook and ICEF Monitor reporting on UK Home Office statistics. Metrics and periods differ by market, so bars show direction rather than a like-for-like comparison.
Canada and Australia tell a different story for several of the same markets, and this is where the picture becomes more mixed. IRCC’s own data on study permits taking effect show every market in this article falling in both 2024 and 2025 following the introduction of the national permit cap. Nepal fell 41 percent and then 42 percent, leaving it at roughly a third of its 2023 level, while India’s decline deepened from 32 percent to 50 percent. The first half of 2026 offers early signs of stabilization for Bangladesh and Pakistan, up 5 percent and 22 percent on the same months of 2025, while Nepal, India, Sri Lanka and Bhutan were still down by between 20 and 44 percent.
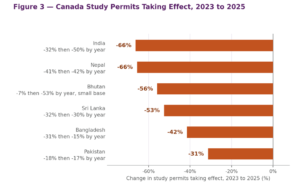
Figure 3 — Canada study permits taking effect, 2023 to 2025, with the annual steps shown beneath each country. Data from IRCC study permit holder data for January 2015 to June 2026, which are preliminary and rounded to the nearest five.
Australia shows both directions at once. Bangladeshi enrollment grew 74 percent in the year to January 2024 and Sri Lankan enrollment grew 41 percent between 2019 and 2024, while Pakistan’s new student visas fell 65 percent in 2024 and Nepal’s visa approval rate dropped from 89 percent to 36 percent between the first five months of 2025 and the same months of 2026.
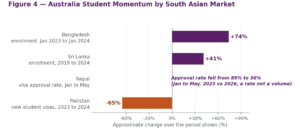
Figure 4 — Australia student momentum by South Asian market. Data from Australian Department of Education, Department of Home Affairs data via ApplyBoard and Kathmandu Post, and ICEF Monitor. Metrics and periods differ by market, so bars show direction rather than a like-for-like comparison.
Taken together, the four destination views suggest that South Asian demand has been redirected rather than lost, rising where access has stayed open and falling where permit caps or tighter approvals have been introduced. Bhutan adds a further point at a very different scale, since a country of fewer than 800,000 people saw the equivalent of 1.5 percent of its population relocate to Australia on long-term visas in less than a year. The sections that follow take each market in turn, from Nepal to India, and bring together every destination for which data was available.
Nepal
Nepal shows clearly how differently the same underlying demand can be treated by different destinations, with US enrollment and UK visa issuance climbing through 2025 while Canadian permits and Australian approvals fell over almost exactly the same period.
- In the United States, enrollment grew 48.7 percent year over year in 2024/25 to 24,890 students, a record high and the fastest growth rate of any country in the sector’s own enrollment data, although that figure reflects students already enrolled and the result of admissions decisions made a year or more earlier.
Calendar-year 2025 looked different for visa issuance. F-1 visa issuance to Nepali applicants fell 55 percent that year, nearly as steep as India’s own 57 percent drop, as new screening and interview requirements slowed processing across the board, which suggests the contraction would appear in the next enrollment cycle rather than the current one.
- In the United Kingdom, Nepali visa issuance roughly doubled in 2025 as part of the South Asian surge that also lifted Bangladesh and Pakistan, and because visa issuance is a leading rather than a lagging indicator it offers the more current read on where Nepali demand is pointed.
- In Canada, study permits taking effect for Nepali nationals fell 41 percent in 2024 and a further 42 percent in 2025, from 15,885 in 2023 to 5,470, and the first half of 2026 was down another 44 percent on the same months of 2025, so the decline shows no sign yet of levelling off under the national permit cap.
- In Australia, where Nepal is the third-largest source country with roughly 60,000 students already enrolled, visa approval rates fell from 89 percent in the first five months of 2025 to 36 percent over the same months in 2026.
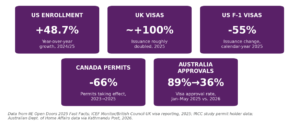
Figure 5 — Nepal rising in two destinations and falling in two others over the same period. Data from IIE Open Doors 2025 Fast Facts, ICEF Monitor and British Council UK visa reporting 2025, IRCC study permit data, and Australian Department of Home Affairs data via Kathmandu Post, 2026.
Bangladesh
Bangladesh follows Nepal in the United States, the United Kingdom and Canada but diverges in Australia, where its trajectory looks closer to Sri Lanka’s.
- In the United States, enrollment grew 17.9 percent year over year in 2024/25 to 20,156 students, a record high that trails Nepal’s and Pakistan’s growth rates but sits well ahead of India’s 9.5 percent.
- In the United Kingdom, visa issuance roughly doubled in 2025 alongside Nepal’s, which means Bangladesh was gaining UK share at exactly the moment India was losing it.
- In Canada, study permits taking effect fell 31 percent in 2024 and a further 15 percent in 2025, from 9,475 in 2023 to 5,540, a gentler decline than Nepal’s that is linked to the same national permit cap rather than anything specific to Bangladesh, and the first half of 2026 was up 5 percent on the same months of 2025, an early sign of stabilization.
- In Australia, enrollment grew 74 percent between January 2023 and January 2024, from roughly 5,600 to 9,683 according to the Department of Education, making it the one destination where Bangladesh grew while Nepal and Pakistan fell.
Country-specific figures for Bangladesh’s calendar-year 2025 US visa issuance were not separately reported at the time of writing, so whether Bangladesh saw the same US contraction that affected India and Nepal remains an open question rather than a confirmed pattern.
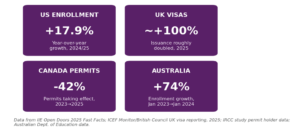
Figure 6 — Bangladesh growing in three destinations and declining in the fourth. Data from IIE Open Doors 2025 Fast Facts, ICEF Monitor and British Council UK visa reporting 2025, IRCC study permit data, and Australian Department of Education data.
Pakistan
Pakistan pairs record highs in the United States and the United Kingdom with a 65 percent drop in Australia and a steadier but more modest decline in Canada, where early 2026 data point to a partial recovery.
- In the United States, enrollment grew 19.8 percent year over year in 2024/25 to 13,165 students, a record high and the second-fastest US growth rate of the three markets behind Nepal’s.
- In the United Kingdom, 2025 visa issuance reached an all-time high, the strongest showing of the three South Asian markets the British Council tracked outside India, and a record level suggests a pipeline built steadily rather than a one-year spike.
- In Canada, study permits taking effect fell 18 percent in 2024 and a further 17 percent in 2025, from 4,730 in 2023 to 3,250, the mildest decline among the markets in this article, and the first half of 2026 was up 22 percent on the same months of 2025.
- In Australia, new student visas fell from more than 11,000 in 2023 to roughly 3,850 in 2024, a 65 percent decline, with 2025 on pace for barely 1,700 and approval rates falling from 88 percent in 2019 to 41 percent in 2024.
As with Bangladesh, Pakistan’s calendar-year 2025 US visa data was not separately reported, so the durability of its US momentum against the broader 2025 contraction remains unverified either way.
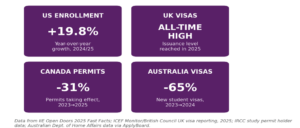
Figure 7 — Pakistan’s all-time UK high and US growth alongside Canadian and Australian declines. Data from IIE Open Doors 2025 Fast Facts, ICEF Monitor and British Council UK visa reporting 2025, IRCC study permit holder data, and Australian Department of Home Affairs data via ApplyBoard.
Sri Lanka
Sri Lanka is the clearest case in the region of demand moving between destinations rather than disappearing, with growth in the United Kingdom and Australia and a slow rise in the United States alongside a sharp pullback in Canada.
- In Canada, enrollment grew 443 percent between 2019 and 2023 to 8,075 students, a rate of expansion with almost no parallel among the markets examined here, but IRCC data show study permits taking effect for Sri Lankan nationals falling 32 percent in 2024 and a further 30 percent in 2025, from 5,150 in 2023 to 2,440, with the first half of 2026 down another 20 percent on the same months of 2025.
- In the United Kingdom, 5,500 Sri Lankan students were hosted in 2022/23, an 84 percent single-year jump that the British Council called “the fastest growing major market for the UK” that year.
- In Australia, enrollment grew 41 percent between 2019 and 2024 to roughly 19,000 students.
- In the United States, enrollment moved far more slowly, up just 7 percent to 3,420 students in 2023/24, the one destination where Sri Lanka looks closer to Nepal, Bangladesh and Pakistan than to its own pattern elsewhere.
The driver appears to be domestic capacity rather than aspiration, since of the 172,000 Sri Lankan students who qualified for a state university place in 2022 only 42,000 secured one, leaving roughly 130,000 qualified students without a place at home in a single admissions cycle. That structural, supply-side gap helps explain why Sri Lankan demand has kept finding new destinations even as the Canadian channel narrowed, since the pressure to study abroad does not depend on any single destination’s visa cycle staying favorable. Where its Canadian permits fell by more than half after 2023, its UK and Australian figures were still rising in the most recent data available for each.
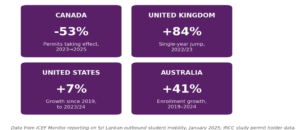
Figure 8 — Sri Lanka’s growth in the UK, US and Australia alongside a Canadian decline. Data from ICEF Monitor reporting on Sri Lankan outbound student mobility, January 2025, and IRCC study permit holder data.
Bhutan
Bhutan’s story runs mostly through a single destination, Australia, while its much smaller Canadian numbers peaked in 2023 before falling back, which shows how thinly its outbound flow is captured by the standard destination-tracking apparatus.
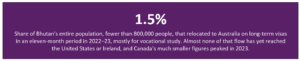
- Fewer than 800,000 people live in the country, yet more than 12,000 left for Australia on long-term visas in an eleven-month period in 2022–23, roughly 1.5 percent of the entire population relocating abroad in under a year.
- The flow was concentrated in vocational programs in childcare, hospitality and accounting rather than university study, so it would not necessarily appear in the enrollment datasets used to track the other five countries even if it diversified.
- Canada has seen far smaller numbers, with study permits taking effect for Bhutanese nationals rising from 300 in 2022 to 760 in 2023 before falling to 710 in 2024 and 335 in 2025, and almost none of the Australian flow has reached the United States or Ireland to date.
In absolute terms 12,000 students is a fraction of Nepal’s or Bangladesh’s US enrollment alone, but in proportional terms it is a share of the national population that none of the other markets in this article come close to matching. Bhutan demonstrates how quickly a small country’s outbound volume can move once a destination opens a viable channel, and it remains to be seen whether that channel opens toward Ireland or the United States next, toward university rather than vocational study, or stays concentrated in Australia as it has to date.
India
India is the one market in this group moving in the opposite direction in most of its destinations at once, though not to the same degree everywhere, and the pattern across those destinations is itself the most informative part of the story.
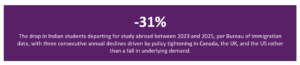
- Total outbound departures fell from 908,000 in 2023 to 626,000 in 2025, a 31 percent drop over two years according to India’s own Bureau of Immigration and now a decline spanning three consecutive years.
- In the United Kingdom, sponsored study visas fell 14 percent in 2024 alone and have kept sliding since the 2022 peak, driven substantially by the January 2024 ban on most student dependents, a single identifiable policy change rather than a gradual drift.
- In Canada, study permits taking effect for Indian nationals fell from 277,945 in 2023 to 188,120 in 2024 and 93,765 in 2025, a 66 percent drop over two years and by far the largest absolute decline among the markets in this article, with the first half of 2026 down a further 29 percent on the same months of 2025.
- In the United States, calendar-year 2025 F-1 visa issuance fell 57 percent even as total enrolled students still grew 9.5 percent to 363,019 in 2024/25, and Fall 2025 new international enrollment fell most sharply among Indian applicants within an overall 17 percent decline, so the contraction is a 2025 story that has not yet fully shown up in the full-year stock data.
- In Ireland, India remains the leading and still-growing source behind a fourth consecutive year of enrollment growth, a record roughly 44,500 international students, in a market with no dependents ban and no permit cap.
That divergence across destinations is among the clearest evidence available that India’s slowdown reflects where the doors are currently open rather than a collapse in Indian students’ own appetite to study abroad.
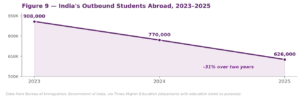
Figure 9 — India’s outbound students abroad, 2023–2025. Data from Bureau of Immigration, Government of India, via Times Higher Education.
Strategic implications for the next recruitment cycle
The country-by-country picture points to a handful of observations that may be useful when thinking about the coming recruitment cycle. They are grouped below by what they say about the signals themselves, about individual markets, about destinations, and about what remains to be seen.
Reading the signals
- UK visa data has so far shown shifts in South Asian outbound behavior first and most clearly, ahead of any comparable signal in US enrollment data, which makes it a useful early indicator even for institutions with no UK footprint.
- The 2025 US visa contraction appears to have been systemic rather than India-specific, so any recovery in processing capacity could plausibly lift Nepali, Bangladeshi and Pakistani volumes alongside Indian ones, which points to a shared US headwind rather than a substitution effect favoring the smaller markets.
- Canada’s two years of decline now cover every South Asian market in this article, from India’s 66 percent fall to Pakistan’s 31 percent, which is consistent with a system-wide permit cap rather than a market-specific shift, although Bangladesh and Pakistan have started to recover in the first half of 2026 and Australia’s tightening approvals for Nepal and Pakistan follow a similar pattern within roughly the same eighteen-month window.
Looking at individual markets
- Nepal, Bangladesh and Pakistan each appear to rise in some destinations and fall in others, with a different combination in every case, so each may be better understood on its own terms than as part of a single “South Asia minus India” or “growing markets” group.
- Sri Lanka and Bhutan show how quickly demand can move between destinations, with Sri Lanka’s Canadian permits falling by more than half after 2023 even as its UK and Australian numbers were rising, and Bhutan’s small Canadian numbers peaking in 2023 while its Australian flow dominated.
Looking at destinations
- Ireland shows that India is not so much a market in decline as one whose access has narrowed unevenly by destination, which suggests that friction-tolerant and friction-heavy destinations may be best read separately rather than through India’s three-year outbound slide alone.
- Germany, France and the UAE appear to be absorbing part of the redirected demand, with Indian enrollment in Germany more than doubling to about 59,400 between 2020 and 2024, in France rising 17 percent to around 9,100 in 2024/25, and Indian students making up some 42 percent of the UAE’s international population, though comparable figures for Nepal, Bangladesh and Pakistan remain limited.
What remains to be seen
- Several open questions may be settled by later data releases, including Bangladesh’s and Pakistan’s calendar-year 2025 US visa figures, whether the early 2026 recovery in Bangladeshi and Pakistani Canadian permits holds through the second half of the year, Nepal’s Australian approval trend, and whether Bhutan’s flow diversifies beyond Australia.
Taken together, the pattern points to outbound demand being redirected by policy friction rather than extinguished by it, with the destinations that keep access open continuing to attract demand that others are turning away. Worldwide Educonnect’s presence across South Asia, alongside its footprint in Latin America, the Middle East, and Africa, allows these shifts to be followed market by market as they develop rather than a year later in a single destination’s enrollment data.
Sources include IIE Open Doors 2025 Fast Facts (US international student enrollment by country of origin, 2024/25). Bureau of Immigration, Government of India, as reported by Times Higher Education (Indian outbound student departures, 2023–2025). British Council 2026 international outlook and ICEF Monitor reporting on UK Home Office sponsored study visa statistics, 2024–2026. ICEF Monitor reporting on US Department of State F-1/M-1/J-1 visa issuance, 2025, and on Fall 2025 new international enrollment survey data. ICEF Monitor reporting on Indian students in Germany, France and other destinations, December 2025, and on shifting demand toward Asian and European destinations, October 2024. The upGrad Transnational Education Report 2024-25 as reported by Business Standard (UAE). ICEF Monitor reporting on Irish higher education international enrollment, 2026, and on Sri Lankan outbound student mobility, January 2025 (Canada, UK, Australia, and US enrollment trends, 2019–2024). The Japan Times, July 2023, on Bhutanese long-term migration to Australia. Immigration, Refugees and Citizenship Canada (IRCC) open data on study permit holders by country of citizenship and year in which permits became effective, January 2015 to June 2026 (preliminary, published June 30, 2026). ApplyBoard reporting on Australian Department of Home Affairs data for Pakistani student mobility, 2023–2025. Australian Department of Education data on Bangladeshi student enrollment, 2023–2024, as reported by Global Student Living. Kathmandu Post reporting on Australian Department of Home Affairs visa approval data for Nepali applicants, 2025–2026.